Reading between the lines of tree rings to reconstruct exactly what happened in Alaska the year that the Laki volcano erupted half a world away in Iceland can help fine-tune future climate predictions.
In June 1783, Laki spewed more sulfur into the atmosphere than any other Northern Hemisphere eruption in the last 1,000 years. The Inuit in North America tell stories about the year that summer never arrived. Benjamin Franklin, who was in France at the time, noted the “fog” that descended over much of Europe in the aftermath, and correctly reasoned that it led to an unusually cold winter on the continent.
Previous analyses of annual tree rings have shown that the entire 1783 growing season for the spruce trees in Alaska was colder than average. But Julie Edwards, a first-year doctoral student in the University of Arizona’s School of Geography, Development and Environment reasoned that since Laki erupted in June, it doesn’t make sense to assume that the entire growing season, which starts in May for the trees they analyzed, was cooler than normal. So, she set out to solve the mystery.
Edwards is lead author of a new paper in the Journal of Geophysical Research that outlines how she and her collaborators, using an alternative method called quantitative wood analysis, painted a different picture of Alaskan climate that year.
Measuring cells in tree rings
What happens to the climate a half a world away from the eruption reflects a combination of forces—what the volcano did and the natural variability in the climate. To really understand how volcanoes affect the climate system, the team looked closely at the structure of tree rings to reveal what happened to the climate on a finer time scale.
“We use these proxy measurements of past climate, including tree rings, as one way to validate our climate models.”
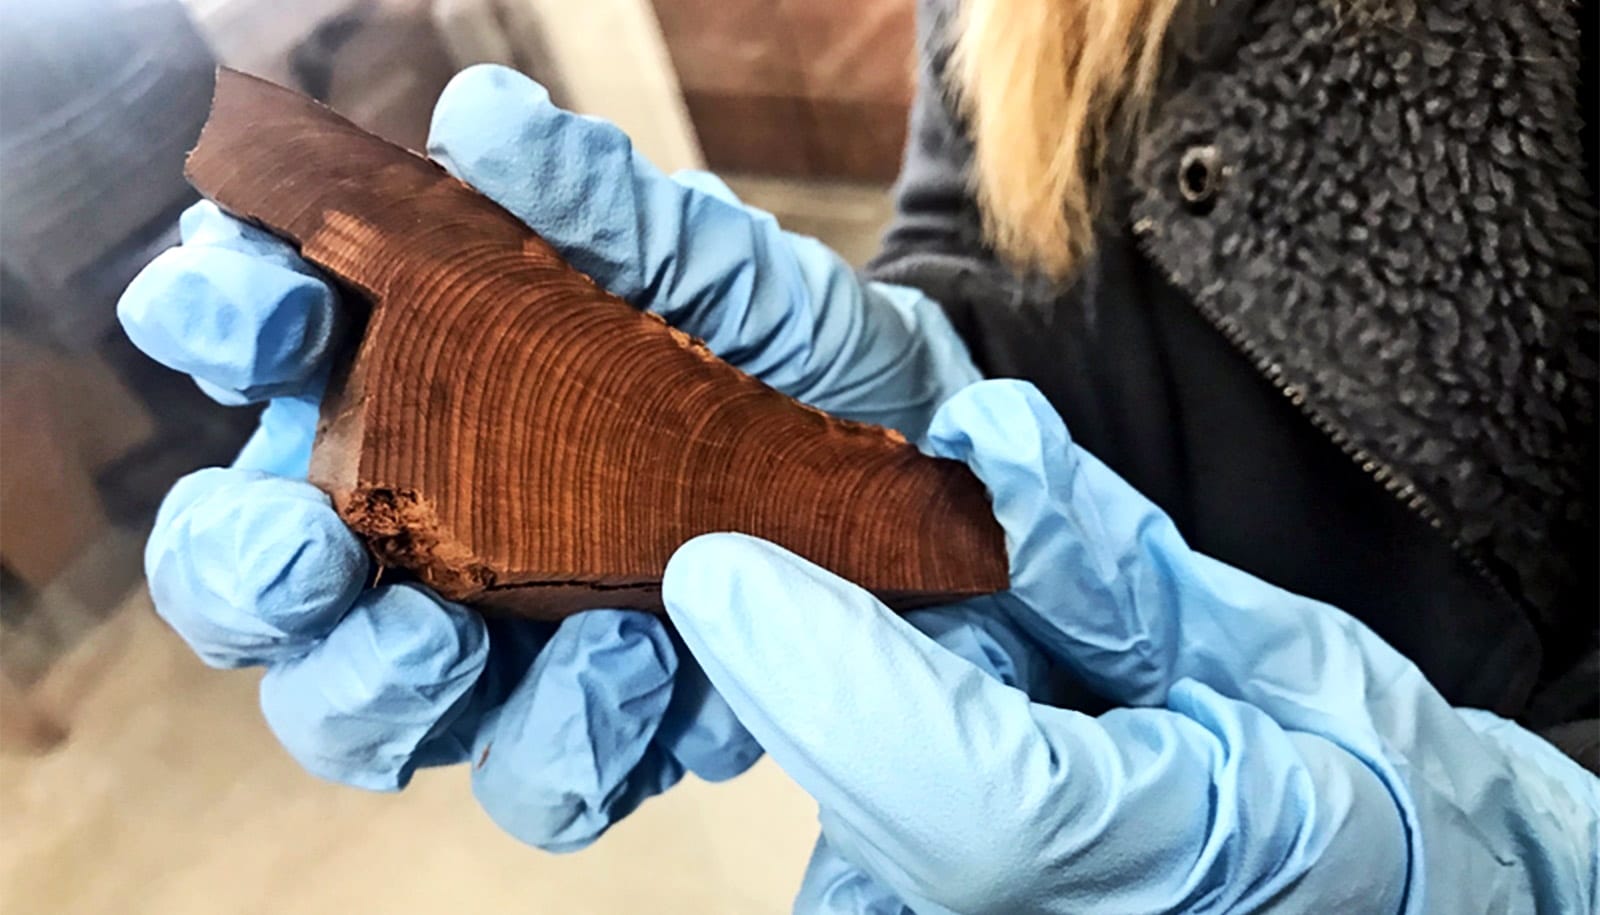
Edwards cut a very thin slice of tree ring and dyed it. Using computer software, she calculated the thickness of each of the stained cells. In warm years, the walls of the cells are thickened, and the wood appears darker. In cold years, however, the cell walls are thin, and the wood appears light and less dense.
“This is quantitative wood anatomy, and what we’re doing is looking at cellular scale measurements on a cell-by-cell basis to see how climate is imprinting on cell growth throughout a season,” Edwards says. “Using this technique, we can measure growth week by week.”
Suddenly cool in Alaska
With this new way of seeing climate history, the researchers found that Alaskan trees in 1783 started off growing like they would in any normal year. A few months after Laki erupted, the trees suddenly stopped growing much earlier than in normal years, and only a very thin wall was formed in the last part of the ring.
“This suggests a sudden cooling at the end of the growing season, which is a different result than what you’d get by just looking at annual tree-ring width or wood density,” says paper coauthor Kevin Anchukaitis, an associate professor in the School of Geography, Development and Environment and the Laboratory of Tree Ring Research.
“What Julie’s work shows is that using this fine-scale analysis, this week-to-week perspective from individual cells, it is possible to explain the previous and unexpected observation that the entire summer of 1783 was cold in Alaska and get a much better perspective on a truly extreme climate event.”
Quantitative wood anatomy
Edwards is one of only a few scientists in the United States to use the quantitative wood anatomy technique. The method has been previously used mostly in Europe, where she participated in a weeklong workshop in San Vito di Cadore, a small town in the Italian Alps, to learn the method from the people who perfected it.
Edwards says it was also important for her and her collaborators to factor in natural variability in climate to check their result.
Partnering with climate modeler Brian Zambri from the Massachusetts Institute of Technology, the team used a computer model to see how natural year-to-year variations in climate could have changed tree growth.
“The model was run a total of 80 times,” Anchukaitis says. “The first 40 times, we allowed the eruption to occur. Then, the model was run another 40 times without the eruption, and we compared the results.”
The researchers saw a wide range of climate conditions following the eruptions. Some years were especially cold immediately following the eruption, but some were warm. Natural variability in the climate seems to overwhelm any cooling from the volcano.
“Many of the model runs agree with what the trees tell us,” Anchukaitis says. “Summer starts normally and then a few months after the eruption, things rapidly get cold. This serves as independent evidence of what we interpret from the trees in 1783.”
The study demonstrates that the traditional way of studying tree rings doesn’t always provide enough detail when studying rapid or extreme climate events, and also that natural variability in the system can be more important than once thought.
“We use these proxy measurements of past climate, including tree rings, as one way to validate our climate models,” Edwards says. “We want to be able to look at these extreme scenarios and have our climate models accurately simulate them and understand the role of natural variability.”
Source: University of Arizona


