Countries with the largest activity disparities between people who walk a lot and people who walk very little have much higher levels of obesity, new research suggests.
In countries with little obesity, people mostly walk a similar amount per day, the researchers found.
Considering that an estimated 5.3 million people die from causes associated with physical inactivity every year, these researchers looked for a simple and convenient way to measure activity across millions of people to help figure out why obesity is a bigger problem in some countries than others.

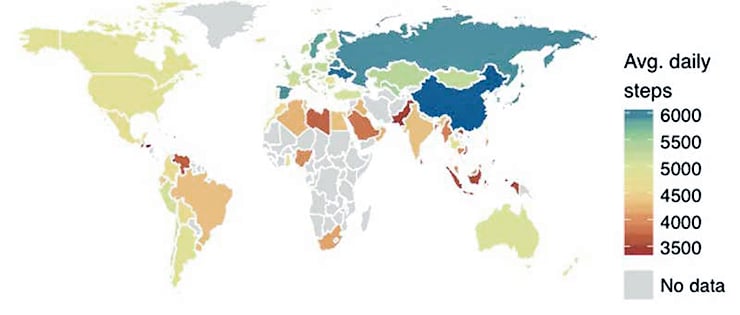
The study used data captured from smartphones to analyze the habits of 717,000 men and women from 111 countries, whose steps were studied for an average of 95 days.
The researchers dubbed this phenomenon “activity inequality” to evoke the well-established concept of income inequality.
“If you think about some people in a country as ‘activity rich’ and others as ‘activity poor,’ the size of the gap between them is a strong indicator of obesity levels in that society,” says Scott Delp, professor and founding chairman of the bioengineering department at Stanford University.
A related finding was the powerful role that gender played in country-to-country differences. Prior studies of physical activity, done mainly in the United States, have shown that men walk more than women, and this was borne out in the global findings. What surprised researchers, however, was how greatly this gender step gap varied from country to country with negative consequences for women.
“When activity inequality is greatest, women’s activity is reduced much more dramatically than men’s activity, and thus the negative connections to obesity can affect women more greatly,” says Jure Leskovec, an associate professor of computer science.
The researchers, who are sharing their findings on an activity inequality website, hope their work will help improve public health campaigns against obesity and support policies to make cities more “walkable.”
Sweden vs. US
Smartphones are equipped with tiny sensors called accelerometers that can automatically record stepping motions. The researchers acquired the data for this study from the Azumio Argus app, which tracks physical activity and other health behaviors.
Azumio anonymized the data but provided key health demographics: age, gender, height, and weight. The last two data points enabled the researchers to calculate each person’s body mass index.
The findings leaned most heavily on data from the 46 countries for which Azumio provided at least a thousand anonymized users, enough to form the basis for statistically valid inferences. The analysis disclosed strong correlations among activity inequality, the gender-activity gap, and obesity levels.
“For instance, Sweden had one of the smallest gaps between activity rich and activity poor, and the smallest disparity between male and female steps,” says Tim Althoff, a doctoral candidate in computer science and first author of the paper. “It also had one of the lowest rates of obesity.”
Meanwhile, the United States ranked fourth from the bottom in overall activity inequality, indicating a large gap between activity rich and activity poor. It was fifth from the bottom in the gender step gap and it has high levels of obesity.
Getting out and about
To better understand the causes and consequences of activity inequality in urban settings, the researchers analyzed a large subset of data from the United States to investigate how the built environments of 69 cities related to activity, obesity, and health.
Prior research had scored each city by how walkable and pedestrian-friendly it is, using factors such as ease of walking to shops, restaurants, parks, and other destinations. The researchers then correlated this walkability index to their smartphone activity data.
Neighborhood ‘walkability’ can boost your health
Team member Jennifer Hicks, director of data science for the Mobilize Center at Stanford, says the results make clear that city design has health impacts: The cities that were most conducive to walking had the lowest activity inequality.
“Looking at three California cities in close geographic proximity—San Francisco, San Jose, and Fremont—we determined that San Francisco had both the highest walkability score and the lowest level of activity inequality,” she says. “In cities that are more walkable everyone tends to take more daily steps, whether male or female, young or old, healthy weight or obese.”
Smartphones everywhere
The technological star of the project was the increasingly ubiquitous smartphone. Nearly 70 percent of adults in developed countries now carry smartphones; in developing nations, the percentage is close to half.
“This opens the door to new ways of doing science at a much larger scale,” Delp says.
But qualifying the smartphone as a tool for this type of research was no cakewalk.
“The methodology was so new that the reviewers were dubious at first,” Leskovec says.
But strong data and rigorous computational methods ultimately proved the validity of this new approach. Now, having qualified the smartphone for research of this sort, the researchers are looking for new ways to leverage this tool.
‘Snapshot’ depicts rising obesity among U.S. kids
“With the appropriate apps and sensors we can push this research in exciting directions,” says team member Abby King, a professor of medicine and of health research and policy. “We could better link activity within and across populations with food intake, or examine the ways activity and inactivity may affect stress or mental health, as well as investigating how best to fine-tune our environments to promote increased activity.”
The study appears in the journal Nature.
Azumio donated the data for independent research. National Institutes of Health grants to the Mobilize Center and the National Center for Simulation in Rehabilitation Research, the SAP Stanford Graduate Fellowship, and the Stanford Data Science Initiative supported the research in part.
Source: Stanford University


